What it Means for the U.S. that Chinese Producer Prices Ended 2021 Over 10% Above Year Ago Levels
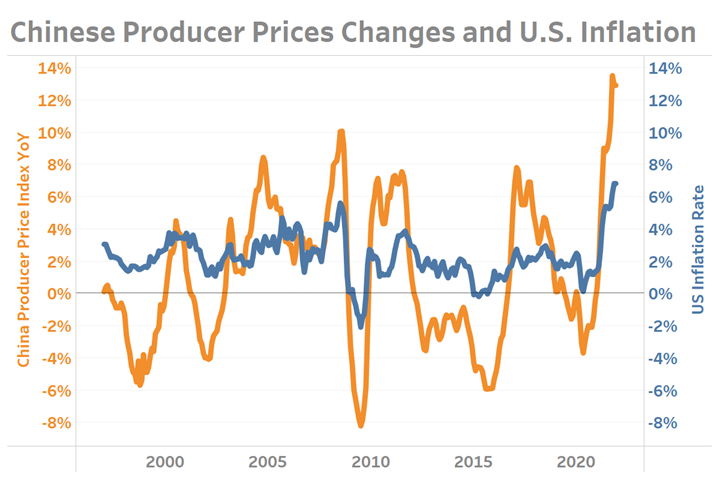
Since the early 2000’s fluctuations in Chinese producer prices have moved directionally with U.S. inflation. Recent and historical data may hold insights to near-term inflation in the U.S.
Thanks to advances in transportation and trade, the world has grown “smaller” in recent decades. As a result, U.S. imports of Chinese goods averaged nearly $430 Billion monthly in the fourth quarter of 2021 according to customs value data from the U.S. Census bureau. A figure that is more than three-time higher than comparable figures from the early 2000’s after adjusting for inflation.
Furthermore, despite the initially severe decline in trade caused by COVID, any long-term damage to America’s imports of Chinese goods appears to be quickly abating. Fourth quarter 2021 goods imported from China were valued at $1.288 Trillion dollars which is both 9.4-percent higher than 4Q2020 levels and nearly 3-percent above the pre-pandemic levels recorded during 4Q2019.
The correlation rate (a measure of the strength of the relationship between two series of numbers) between U.S. inflation and Chinese Producer Prices over varying periods of time sheds light on a powerful association between these countries. Between 1997 and the end of 2021, the correlation rate between these two series was just over 75%; however, in the 5-years ending with December 2021, that correlation rate increased to almost 85%. This is why knowing something about Chinese producer prices may be instructive when thinking about U.S. inflation.

Year-over-Year changes in the Chinese Producer Price Index and U.S. Inflation Rate between January 1997 and December 2021.
Without performing significant amounts of calculations, one of the more interesting observations about the above data are the points at which the lines cross. Chinese Producer Price Index (PPI) readings often climb above the U.S. inflation rate just as inflation begins to move higher. The same appears generally true in reverse as PPI values move below the U.S. inflation rate both move lower thereafter. This general relationship appears in the 2003 through 2011 time period. The pattern is less evident or even fails in the late 1990’s and in 2015.
If one is willing to believe the theory that large swings in Chinese producer prices have small but meaningful affects on U.S. inflation rates, then the implication seems clear that elevated U.S. inflation will be both high and enduring in 2022. Only once Chinese production costs begin to normalize might prices rises in the U.S. also begin to normalize. American manufacturers and consumers wanting to track Chinese PPI data themselves may access this data for free from the St. Louis Federal Reserve Bank.


.jpg;width=70;height=70;mode=crop)
