Housing Permits Show Continued Strength
Total permits in the three-month period ending August 2020 were the highest three-month total since July 2007.
There were 126,200 housing permits filed in August 2020. Total permits in the three-month period ending August 2020 were the highest three-month total since July 2007. COVID-19 and work-from-home policies have created demand for new homes in the suburbs at the highest rate since the housing bubble burst and the Great Recession followed.
Permits filed in August were down 1.3% compared with one year ago, ending two consecutive months of double digit growth. Housing permits have grown for the 11 of the last 14 months. In August, the annual rate of growth decelerated to 6.0%. August was the 12th-straight month of growth and the sixth of the last seven with growth faster than 5.0%.
The real 10-year Treasury rate, which is the nominal rate minus the rate of inflation, was -0.81%. This was the eighth consecutive month and 11th of the last 13 that the real rate was negative. Inflation increased to its highest rate since March.
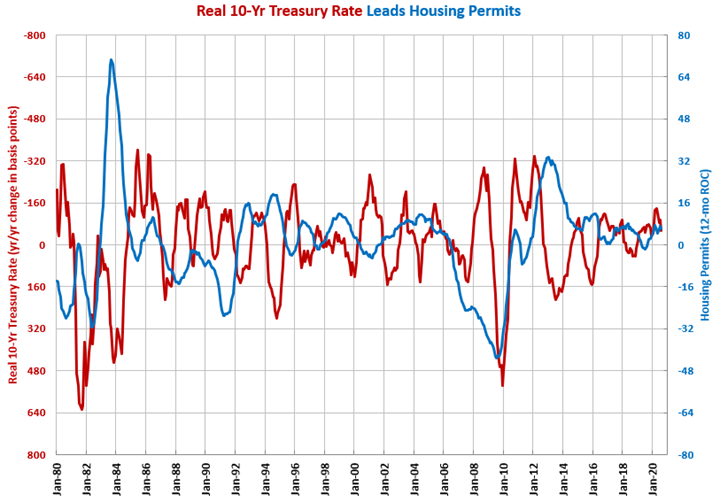
In August, the year-over-year change in the real rate was -54 basis points. The change was negative for the 20th month in a row. The change was at its highest level since January. In general, the trend in the year-over-year change in the real 10-year Treasury was moving down (more negative) in the last six years. In order for that trend to continue, the rate of inflation needs to accelerate since the Federal Reserve has stated it has no desire for nominal rates to go below zero.
The change in the 10-year Treasury rate is a good leading indicator of housing permits and construction spending. A decreasing year-over-year change in the real 10-year Treasury rate typically leads to increases in these data points down the line.


.JPG;width=70;height=70;mode=crop)
