Beware of Forthcoming Annualized Change Readings
Having surpassed the 1-year mark since COVID-19 forced the shutdown of much of the global economy, expect to see a swelling number of articles report drastic growth in virtually everything. This will require business leaders and forward-looking decision makers to take additional precautions when using new data releases over the coming months and longer.
Most headlines report metrics by citing the latest value along with the percent change in that metric compared to the same period one year ago. Given that March 2021 marks the 1-year anniversary of COVID-19 and that much of the March 2021 data are now being released to the public, we should all expect to see headlines now — or in the very near future — begin reporting huge percent changes in monthly rate-of-change data.
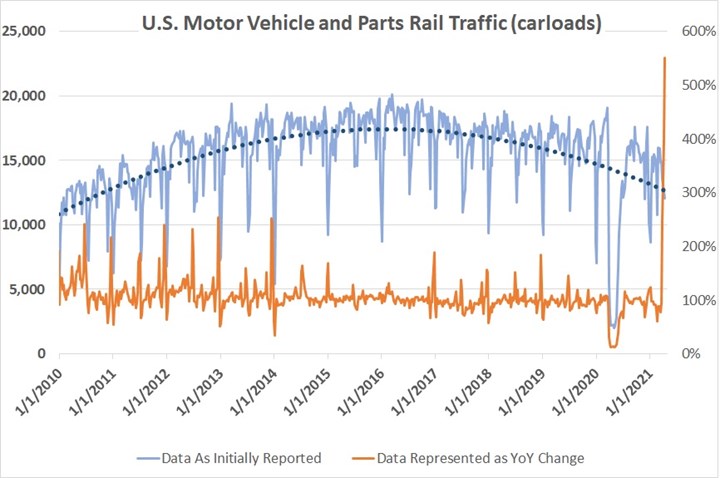
This presents a challenge for decision makers who are accustomed to translating single-digit — or low double-digit — change data into forward-looking decisions for their business. A recent example of this is found in the U.S. Motor Vehicle and Parts Rail Traffic shown below. Examining the data when represented as the change from a year ago, traffic in the last three weeks was up 249%, 397% and in the latest April 10th release, up 551%. However, if you examine the data in absolute terms, one observes that the last 9 months of rail traffic is trending flat to slightly lower; extending a pre-COVID-19 decline.

Railcar activity in absolute terms has been trending down slightly since 2016. However, due to the sharp drop in economic activity caused by COVID-19 in early 2020, the latest data indicate a +500% increase in activity compared to a year ago. This and many year-on-year metrics like it will need to be more carefully scrutinized from now on before being used by business decision-makers.
This example stresses the point that it will be important for all forward-looking decision makers to closely scrutinize the results of those data series that they rely on for making important decisions. Consider at a minimum examining all data series in various states such as absolute measure, percent change and moving average and then compare the long-term trend(s) in the data against more recent trends. When looking at any data reported in percent-change format, consider which months of data are being used in the calculation to assess how COVID-19 has been improperly influencing the trend results.


.jpg;width=70;height=70;mode=crop)
