Disposable Income Growing, but for How Long?
In June, real disposable income was $16,028 billion, which was 8.1% more than one year ago. The extreme month-over-month rate of growth in disposable income is a direct result of government payments to individuals.
In June, real disposable income was $16,028 billion, which was 8.1% more than one year ago. While this was the third consecutive month (and the only three months ever) with income more than $16,000 billion, June income was down almost $1,000 billion from April. The 8.1% growth rate in June was more than 2.5 times the historic average month-over-month growth rate in real disposable income.
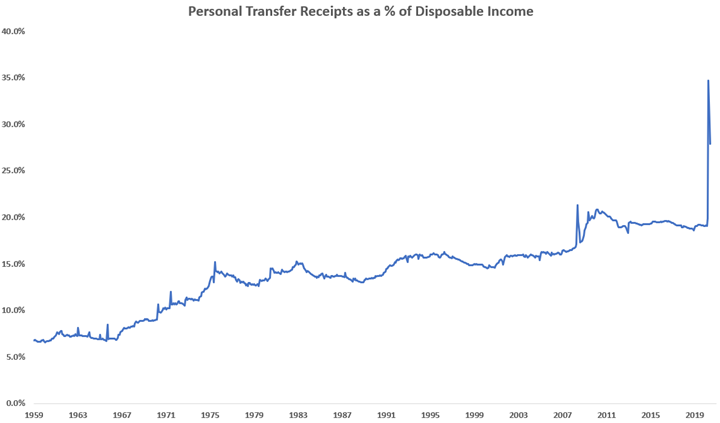
The extreme month-over-month rate of growth in disposable income is a direct result of government payments to individuals. Compensation from employees contracted more than 2.3% each of the last three months, which were the first months of contraction since January 2010. At the same time, government transfer payments (e.g. unemployment benefits, $1,200 stimulus checks) increased at least 58.1% each of the last three months. As a result, government transfer payments made up more than 25% of all U.S. disposable income for the third straight month.

Will these payments continue? Is it sustainable for the government to supplement income while increasing the deficit? Can transfer payments continue to increase at a faster rate than GDP? If not, how far will disposable income fall and how severely does it affect the economy?
The annual rate of growth accelerated to 4.1%. This was the fastest rate of annual growth since December 2015. Normally, this kind of acceleration would lead to a dramatic increase in consumer spending. However, this clearly has not happened since the start of the pandemic. Keep in mind that changes in real disposable income typically lead capital equipment consumption by almost 24 months.


.JPG;width=70;height=70;mode=crop)
