April Machine Tool Orders Lowest Since May 2010
While machine tool orders continue to contract at an accelerating rate, several of the early leading indicators of machine tool orders have trended in a positive direction for a number of months.
April machine tool orders were 1,349 units and $219,108,000.
April’s unit orders were the lowest monthly total since May 2010. Orders for the month contracted 36.9% compared with a year ago, which was the fastest month-over-month rate since October 2009. This was the 10th month in a row of contraction and the eighth in the last nine with a rate of contraction faster than 20%. The annual rate of contraction accelerated for the fourth month in a row to -20.2%. This was the fastest rate of annual contraction since May 2010.
Dollar orders contracted 37.6% compared with one year ago. This was the 15th straight month of dollar order contraction and the 16th in the last 17 months. April was the 10th month in a row of accelerating contraction in the annual rate of change in dollar orders as the rate of contraction fell to -24.0% from -22.2%. This was the fastest rate of contraction since May 2010.
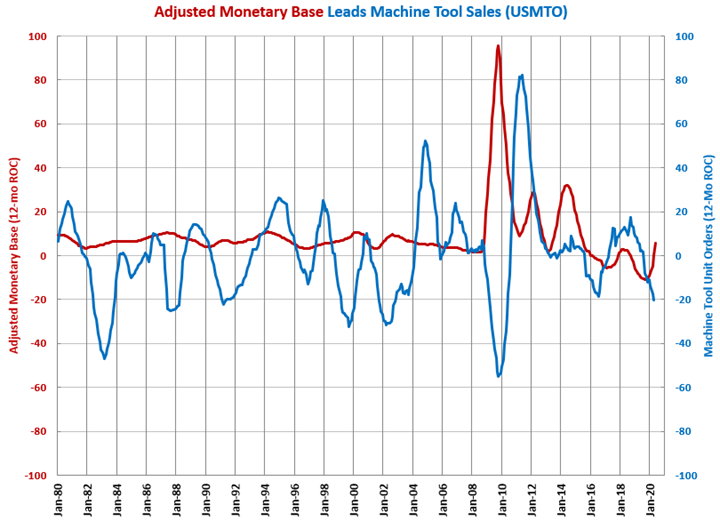
Several of the early leading indicators of machine tool orders have trended in a positive direction for a number of months.
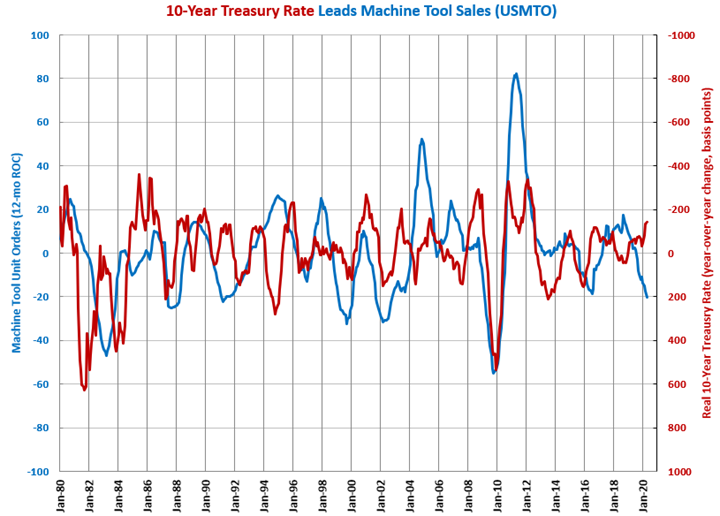
Year-over-year, the 10-year Treasury rate was trending lower since November 2018. In April, the year-over-year change was at its lowest level since the summer of 2012. Typically, the change in the 10-year Treasury rate leads machine tool orders by 12-24 months.


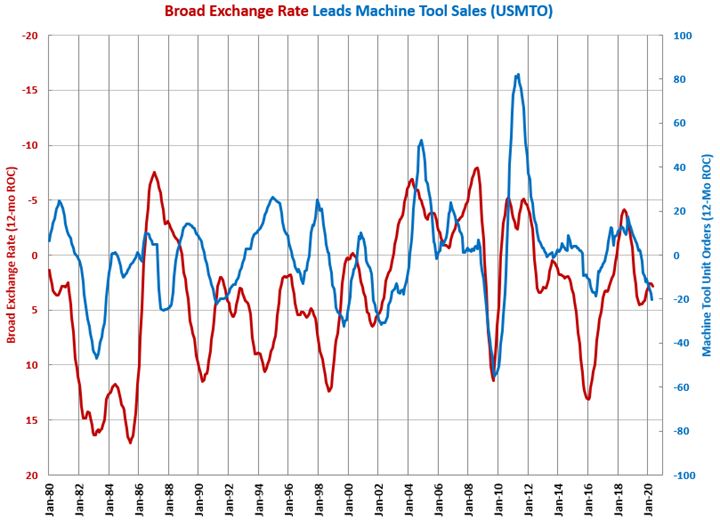
A decline in the 12-month rate of change in the U.S. dollar’s broad exchange rate (a composite exchange rate against all other currencies) tends to lead machine tool orders since a lower exchange rate makes U.S. manufacturing exports cheaper around the world. The rate of change in the exchange rate started falling (rising on the chart) in June 2019. Given the 12-24 month lead time between the broad exchange rate and machine tool orders, this leading indicator was pointing to a bottom in the 12-month rate of change in machine tool orders in late 2020.


.JPG;width=70;height=70;mode=crop)
